how to use this site
common page layout
The top section of the page will show on every page (as you can see above). It gives a weather forecast over the next 12 to 24 hours and the date and time of the latest details recorded.
If you click (or touch) the top Peppo Weather Station title you will be brought to the dashboard page.
The bottom section of every page will show the menu buttons, including help and about (scroll down the end to see)
The background image will change based on current conditions (not forecast), and I only bothered to find 10 images (rain, clouds and clean sky at various degrees) so it may not be really accurate. At night there will be a gray background.
IMPORTANT NOTE: the page does not automatically refresh (to avoid overwhelming the server), just click the Refresh button whenever you need up-to-date information.
dashboards (the home page)
The main page shows a number of dashboards giving information of the current situation (between 5 to 15 minutes in the past).
By clicking (or touching) on the dashboard title you will be brought to the relevant chart (see below the chart section), a part from the Current Conditions dashboard which will bring you to the extremes page.

the rain danger dashboard
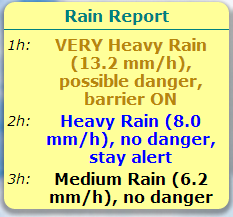
In case of heavy rain an additional dashboard (see image to the left) will show up at the top of the dashboard page giving a number of danger levels.
Each danger level is prefixed with one of the following: 1h, 2h, 3h, 6h, 24h followed by a comment.
Basically the service will analyze the raining data over 1,2,3,6 and 24 hours calculating for each the average rain fall, total rainfall and trend.
For each set of data (1,2,3,6 and 24 hours) a danger level will be calculated and reported whenever required along with a description and value of the rainfall rate.
The algorithm is still under fine-tuning and may issue un-required low-level warnings, however, better safe than sorry ;p).
There are five different danger level issued by the service: Medium Rain (1), Heavy Rain (2), Very Heavy Rain (3), Critical Rainfall Rate (4), Possible Flood Threat (5)
The message will state the danger level, the mm/h of rain over the given period and a comment.
extremes
This page shows extreme measures: minimum, maximum and average for today and for all the period currently on the on-line database, which is usually 60 days. The time the extreme was recorded is also given for minimum and maximum values (as dd/MM HH:mm).
charts
This pages shows two charts, the top one gets data from the detailed records stored every 5 minutes and shows, by default, the last 24 hours (on mobile devices) or 48 hours (on desktops), this chart is very useful to grasp short term trends.
The bottom chart gets data from the daily average and extremes records stored every day and shows, by default, the last 30 days (on mobile devices) or 180 days (on desktops), this chart is very useful to grasp long term trends.
how to adjust the charts
Each chart has a drop down selection box to change the data source of the chart, a box where to enter the last hors/days to show in the chart and the last box is to change the chart's width in case you like to make it wider or narrower.
If you select a chart from the drop-down list the page will automatically refresh, if you change a value in a text box you need to hit the enter key to refresh the page.